Case study
AI Use-Case Intake & Prioritization Console
Demonstrates
Structured AI-opportunity scoring a human can override, with a first-class judgment about where AI does not belong.
- Shipped
- Lenses
- Product & delivery (primary)
- Applied AI
- Stack
- python · fastapi · jinja · htmx · sqlite · anthropic-api
- Links
- Repo
On this page
Overview
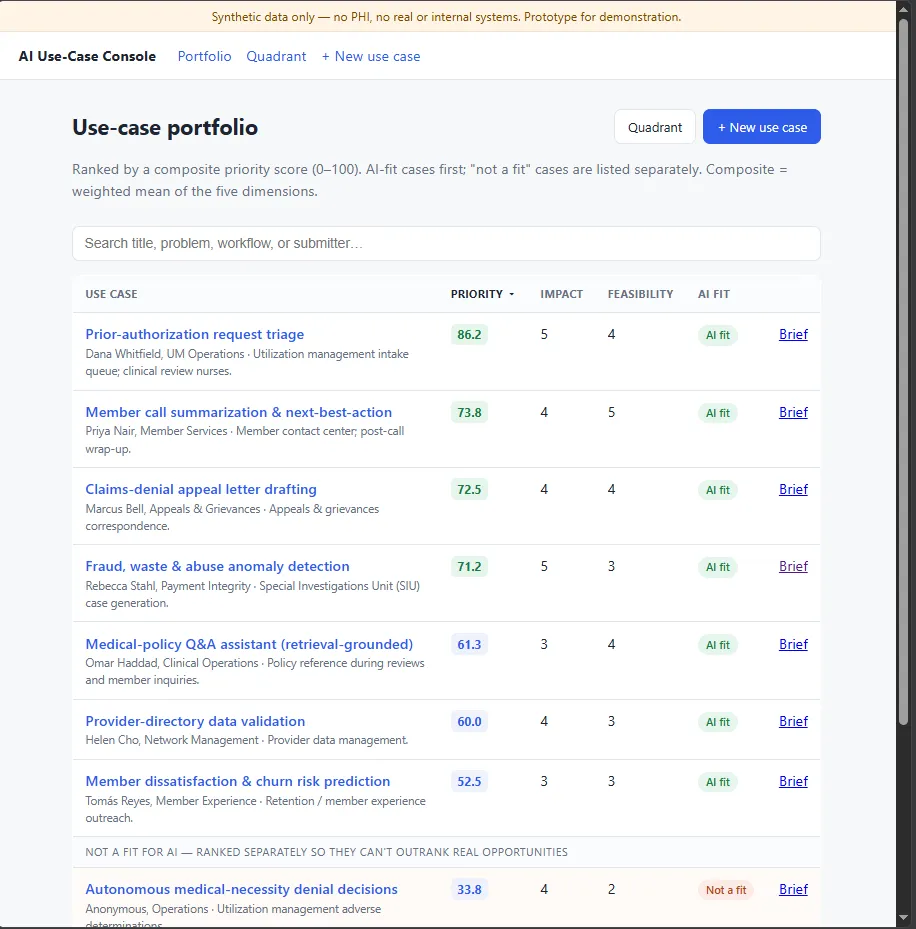
The console is the tool an AI-innovation function would use to turn a stream of proposed ideas into a ranked, explainable portfolio. Each use case enters through a structured intake — problem, affected workflow, data availability, stakeholders, current pain — and is scored across five dimensions: impact, feasibility, risk, adoption and strategic value, each with a written rationale and an ROI hypothesis. A composite priority score orders the portfolio, an impact-feasibility quadrant plots it, and a one-page decision brief summarises any single case for an executive audience.
The distinctive output is the negative one. A case judged a poor fit for AI is labelled “not a fit” and ranked in its own band, so it cannot outrank a real opportunity. The judgment about where AI does not belong is a first-class part of the portfolio rather than an omission. And the model never decides: it proposes every score, and a human can override any value.
The problem
Organisations adopting AI accumulate more ideas than they can act on, with no consistent way to compare them. Decisions get made on enthusiasm rather than evidence, nobody records why an idea was greenlit, parked or rejected, and the result is wasted pilots and no audit trail.
The hardest judgment, and the one least served by the usual AI-opportunity tooling, is the negative one: which ideas AI should not touch. A console that scores everything as an AI opportunity, and ranks a case that should never be automated alongside one that should, is worse than a spreadsheet, because it lends the bad idea a number.
Constraints
Synthetic, authored data only. No PHI, no real claims or members. The seed is a small set of realistic healthcare-payer use cases.
The model proposes; a human decides. Every score is a proposal the reviewer can override, and nothing is prioritised or approved automatically.
A score has to be explainable. Each dimension carries a rationale, because an unexplained number is not usable for a portfolio decision.
A privacy-preserving path had to exist. A local-model option through Ollama runs scoring with no external calls, for a sensitive environment.
The scoring has to be checkable rather than asserted: stability, the “not a fit” guardrail, and rubric adherence are all measured.
Architecture
The flow is intake, then score, then rank, then brief. Intake captures the structured fields for a use case. Scoring sends those fields to the configured provider — a frontier model, a local Ollama model, or a deterministic stub — and gets back a score per dimension with a rationale and an ROI hypothesis, with the composite priority score as the weighted mean. The “not a fit” flag is part of that judgment: a poor-fit case is marked and sorted into a separate band. The portfolio, the quadrant and the brief are views over the stored scores.
Human override is the spine rather than a bolt-on. The reviewer opens a use case, sees the proposed score card with its rationales, and can override any dimension. The record is append-only, so the history of proposal and override is kept.
Scoring is evaluated by its own harness, make eval, which re-scores the seed set with the configured provider and checks the three properties the console claims: that re-scoring is stable, that the poor-fit cases are flagged, and that every score carries its rationale.
Key decisions
Chose a decision aid over a decision maker. Every dimension is an overridable proposal and nothing is prioritised automatically. The cost is that a person stays in the loop, which for a portfolio decision is the point rather than the price.
Chose explainability as a feature rather than a nicety. Every score carries a per-dimension rationale and an ROI line, because a number a reviewer cannot defend is a number they cannot use. The cost is more model output to produce and to check for adherence.
Chose to make “not a fit for AI” a first-class output, ranked separately. The negative judgment is surfaced and sorted into its own band, so a case that should never be automated cannot outrank a real opportunity. The cost is that the flag is a judgment prompt rather than a policy engine — a human still weighs it.
Chose to measure the scoring rather than assert it. make eval reports re-scoring stability, the recall of the “not a fit” guardrail, and rubric adherence, so “explainable and consistent” is a number. The cost is that it runs on a fixed synthetic seed and is calibrated to a rubric rather than to human raters.
Chose to ship a local-model option. Ollama runs the whole scoring path locally with no external calls, which is the privacy-preserving deployment for a sensitive environment. The cost is local-model quality measured against a frontier model’s.
How it’s verified
make eval re-scores the synthetic seed with the configured provider and checks the three properties the console claims.
| Check | Result |
|---|---|
| Guardrail — the “not a fit for AI” cases are flagged | 3 / 3 |
| Rubric adherence — a rationale per dimension and an ROI line, on every score | 30 / 30 |
| Stability — composite spread across three re-scorings on the real model | mean 5.71, max 17.4 points on a 0–100 scale |
| Automated suite, offline, passes cold without a seed | 40 tests |
The eval defaults to the deterministic stub so that it always runs, and it names the provider that produced each figure. That default is also where the number can mislead: on the stub the stability spread is 0.0, which is an artefact of determinism rather than a measurement, and the guardrail recall reflects keyword heuristics rather than model judgment. The stability figure above is from re-scoring on the real model, which is the only place run-to-run variance exists to be measured.
What I’d do differently
Make the stub-versus-provider distinction loud from the start. The trap was in the eval rather than the console. On the deterministic stub the stability check reports a spread of 0.0, which looks like perfect consistency and measures nothing. The property that matters — a model’s run-to-run variance — only appears with a real provider, and there it is real: composite scores drift a mean of 5.7 points across re-scorings, and up to 17 on a single case.
Grow the set, and add a second scorer. Ten authored use cases exercise the pipeline end to end but are not a real portfolio, and the scores are calibrated to a rubric rather than to human raters. A second scorer would let the eval report inter-rater agreement — which matters more once you know the model alone can move a case by 17 points.
Limits
A decision aid, not a decision maker. The model proposes; a human reviews and can override every value. Nothing is prioritised, approved or funded automatically.
Ten synthetic use cases. A small authored set for a healthcare-payer context, enough to exercise intake, scoring and ranking end to end. Not a real portfolio, and carrying no real claims, members or PHI.
Rubric-calibrated, not rater-calibrated. The eval checks stability and rubric adherence. It does not measure agreement with expert human scorers.
The “not a fit” flag is a judgment prompt, not a policy engine. It surfaces a likely poor fit for a human to weigh; it is not a compliance gate.
Links
The repository is linked at the top of this page. make eval prints the scoring report — stability, guardrail recall and rubric adherence — and runs offline on a stub, or against a real or local Ollama provider. Inside the app, the portfolio ranks the opportunities, the quadrant plots them, and each use case carries a one-page decision brief.